- Published on
Food Affordability

- Name
- David Chung
- @dchung1997
Food Affordability and Undernutrition are issues that many parts of the world are still struggling to deal with. It can happen for a variety of reasons a bad harvest due to drought, interregional conflicts that displace families, and poverty. Often the causes behind undernutrition are out of the control of the people affected.
One of the most common reasons behind Undernutrition is due to the inability to afford having consistent meals. An estimated 1.1 billion people around the world cannot afford an energy sufficient diet. With around 735 million people sufferring from undernutrition in 2023. But is it an issue and how does it impact the lives of people who suffer from it?
For most people undernutrition weakens the immune system, it impacts focus, and increases your risk for injuries. For individuals who end up hospitalized it lengthens the duration of stays. But for people who are pregnant, elderly or young children it can impact them the most. Around half of all child deaths under 5 are attributed to undernutrition.
Let's look at the costs and impacts of varying diets in respect to Food Affordability and Undernutrition throughout the world and how governments can make small changes to improve the lives of families and children.
Food Sufficiency and Outcomes
To start off what exactly are these diets that groups like the Food Administration Organization (FAO) talk about when addressing issues such as hunger and food insecurity and why do they matter?
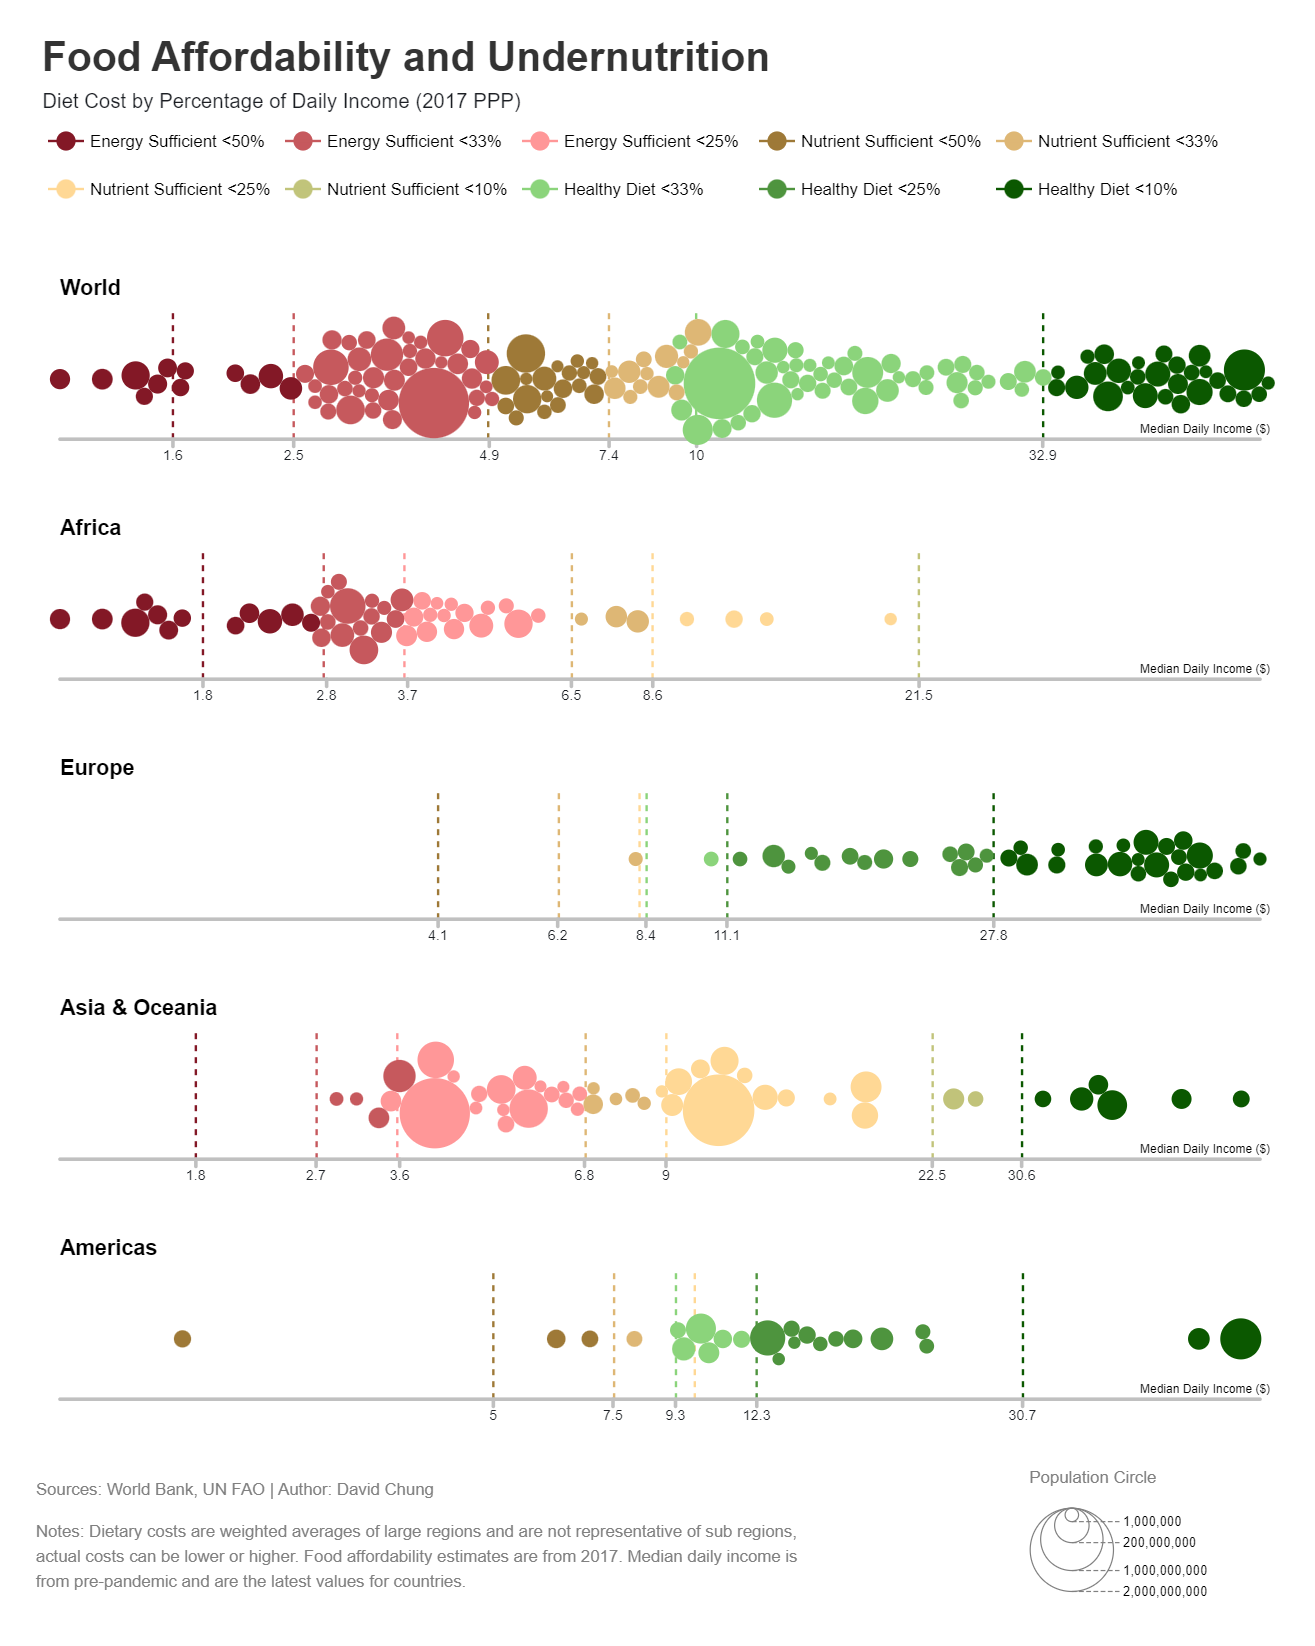
Energy Sufficient Diets deal with extreme undernutrition for issues such as wasting which typically occurs when an individual is below the normal range of weight for a given height. They provide the bare minimum amount of calories for an individual to be considered normal weight. While households may not be dying of starvation having to constantly spend large portions of their income on food heavily limits the options of these households.
Nutrient Sufficient Diets deal with chronic undernutrition dealing with a deficiency of essential nutrients which impacts how the body grows. Nutrient Sufficient Diets deal with stunting which can have an impact on adult cognition later on in life. It impacts the ability for a child to learn with many children sufferring from stunting having lower cognitive abilities that non-stunted children. Changes to diet at any point in a childs life can significantly reduce the impacts of it on a childs performance.
Finally Healthy Diets. A Healthy Diet can vary depending on the culture, they can be similarly priced to Nutrient Sufficient ones. A Healthy Diet protects against malnutrition in all of its form as well as noncommunicable diseases, including diabetes, heart disease, stroke, and cancer. However it's important to note that they may not be entirely accurate as they do not necessarily account for cultural values or dietary restrictions.
Government subsidies and food programs could help households in regards to malnutrition and undernutrition and many countries do exactly that. But its not always a priority for governments and for many it can be unaffordable. Organizations such as the UN Food Program try to help countries in need especially areas that are experiencing crisis and famine.
Regional Outcomes
Outcomes aren't always equal. While Europe and the Americas faired better than most. Across all regions countries still struggled with food insecurity. Let's look at how countries faired in their respective sub-regions.
For the most part in the Americas countries did well in comparison to other regions. Some Central and South American need more help than others. Outliers existed with Canada and the United States being much further ahead but struggling with other issues namely obesity. Meanwhile on the other end Haiti was worse off, it's likely that Cuba is in the same situation but there isn't any data to support this.
An interesting thing to note here is how small the difference between a nutrient sufficent diet and a healthy diet can be. But even then a healthy diet costing 33% of a household's income while a nutrient sufficient one only costing 10% of a households is still a significant gap.
The Bottom 10% of households in the Americas with the exception of North America still struggled to afford Nutrient Sufficient Diets. South and Central American countries struggled the most with 25-50% of households having issues in regards to being able to afford Nutrient Sufficient Diets. Haiti, Belize, Guatemala, Honduras, and Venezuela were countries where at least 25% of the population needed to spend 50% of their income to be able to afford a Nutrient Sufficient Diet.
Europe was the only region to consist of the majority of countries that were able to afford healthy diets. Parts of East and Southern Europe still had significant portions of their population struggling to afford nutritionally sufficient diets. These countries could benefit from programs to help lower food costs for those in need. Though for most countries, obesity rates in Europe have been on the rise this seems to be more due to an excess of calories.
The nations that are trailing behind in regions tended to be relatively new with many being former members of the Eastern Bloc. These are countries such as Moldova and Ukraine in the East to Albania, Bosnia, Montenegro, North Macedonia and Serbia in the South. In Northern Europe Latvia, Lithuania, and Estonia were all former soviet republics as well. In comparison to other former republics they are fairing better but the gap between them and other Nordic countries is large.
Asia and Oceania is a large subcategory. Encompassing regions such as the Middle East all the way to Polynesia. Median daily income tended to vary though East Asian countries tended to be the wealthiest. Russia also makes an appearance on this however, the accuracy of the results is questionable due to it likely referring to wages on the European side rather than in Siberia.
Countries like Cyprus, Malaysia, and Australia make a notable appearance though New Zealand does not make an appearance on this list. With the exception of East Asia most Asian Regions were grouped similarly. Though there were outliers like Qatar and the UAE, the high incomes are more likely due to the fact that migrant workers were not accounted in their median income calculations which would bring these countries to similar levels as the others mentioned as over 80% of the population of the two nations are migrant workers.
For the most part almost all countries dealt with food insecurity in some form. With the majority of regions still unable to afford healthy food and were dealing with varying level of being able to afford Nutrient Sufficient Diets. In many countries the bottom 25% struggled to with being able to afford Energy Sufficient Diets. But data
Africa is where the problems begin to arise. For many East and Central African countries they struggled with being able to afford Energy Sufficient Diets. With nations having more than half of their households being spending at least 50% of the income on them.
For the majority of African countries being able to afford an Energy Sufficient Diet was still a problem wth at least 25% of households not being able to afford them. Nutrient Sufficient Diets were still largely unaffordable with only the top 10% of households in some nations being able to afford them to some degree.
It's estimated by 2050 that 2 in 5 children will be born on the continent. From 2020 to 2050 it's expected for the population to increase by 50%. But in many parts of Africa real wages have been stagnate for decades.
African Countries Daily Income or Consumption (PPP)
Median Daily Income Difference Between 2000-2020, 5-10+ Years
Economic growth in Africa has been largely unequal. While some countries grew overtime others contracted or didn't change. Sometimes countries stopped reporting on varying metrics when used to calculate the median daily consumption (income). What's notable is how West and South African countries grew in comparison to others. But in many cases it seems as though for many countries they stopped reporting information once economic conditions became uncertain.
Annual Average Real Wage Growth
Africa 2010-2020
Over the past decade real wage growth in Africa showed some growth coming into the decade but since then has seen a reversal of this trend. While food prices have been staying relatively consistent in increases with inflation for many African countries their economies are not growing enough to see any progress. With many countries becoming worse off since the previous decade.
Total Average Real Wage Growth
Africa 2010-2020
It's a problem especially with climate change on the horizon. How the future of Africa is shaped could be a story about the diverging economies of nations and even possibly about the gap and differences between the Rural and Urban populations. But data on this is hard to come by and by the time any changes are made inequality could be embedded deep into these societies.
Overall, food affordability remains an issue around the world. While it disproportionately impacts certain regions more than others the cost of healthy food is still often out of reach for many people. For some countries it could possibly take decades to make progress towards ending issues like hunger and food insecurity and for others they might not make any progress at all.